Sometimes I have a picture of a software design in my head and I just want to draw it. If I don’t need to collaborate with anyone remotely I might just draw it freehand. For collaborations and for diagrams I might want to iterate on, a tool like LucidChart can be really handy.
But sometimes I just want to list concepts as I hear them, fill in the connections between them, and let a computer worry about layout. That’s what the tools below are all about. The particulars of each tool differ, but all of them let you enter a simple text description, e.g.:
[Chili]-->[Beans]
[Chili]-->[Tomatoes]
[Chili]-->[Onions]
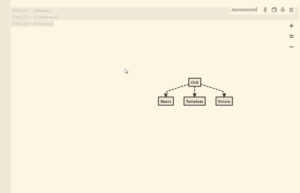
And they will turn it into a visual diagram, like so:

(This diagram was generated by nomnoml).
I poked around at several of these tools, and here’s what I found. I’m listing these in order of how much I liked them, favorites first.
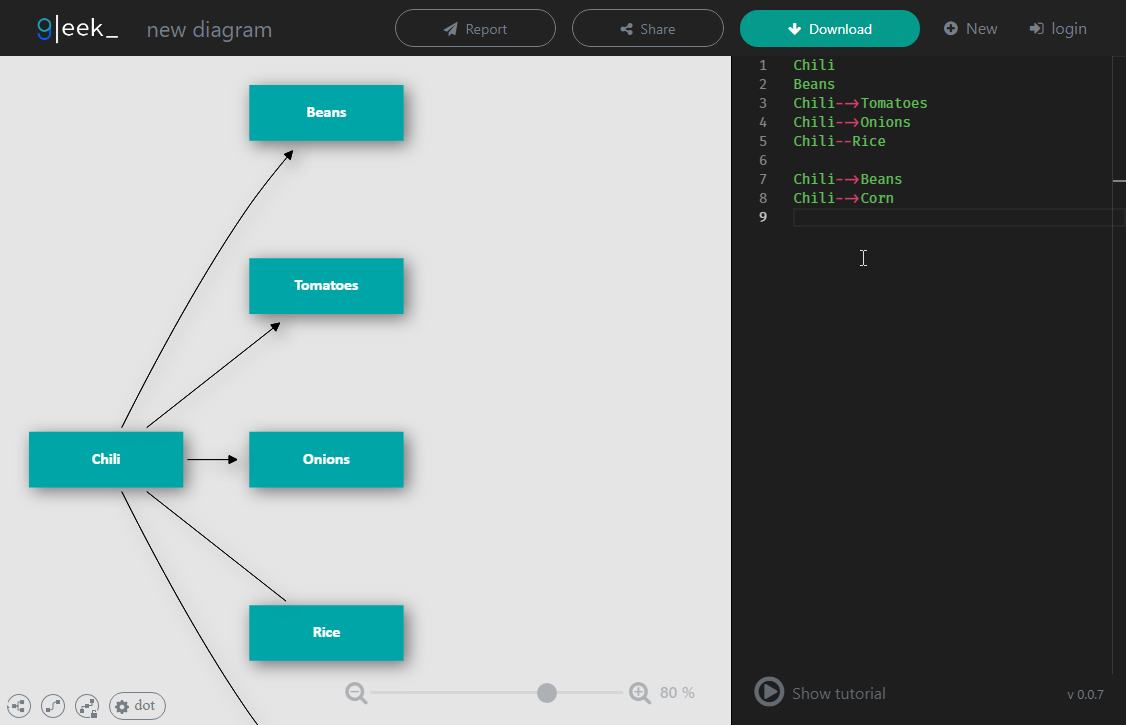
 Beautifully slick interface, autocompletion, ultra-simple syntax, some nice options to adjust the generated layouts. I really like gleek. Types of diagrams: graphs only.
 nomnoml has a gorgeously spare and clean UI and a really pleasant user experience. Types of chart: graph only.
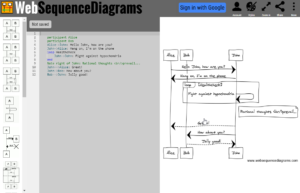
WebSequenceDiagrams
 As the name suggests, this site is strictly for creating sequence diagrams. It generates them in a fun, informal, hand-drawn style, and has a servicable interactive editor.
yUML
 A messier, less pleasant and less powerful UI than gleek or nomnoml. But yUML can generate class diagrams, activity diagrams, and use case diagrams. It also has an option for generating either “slick” or “scruffy”, hand-drawn-style images.
Mermaid
Mermaid is a JavaScript library for generating various types of diagram from text descriptions. There’s an online demo, but like PlantUML it’s mainly intended for integration into other tools. For instance, you can get VSCode extensions that let you live-preview Mermaid diagrams embedded in Markdown files.
PlantUML
PlantUML is software that you download and use locally; the website is mostly just ads. PlantUML is interesting because it can be embedded into other text documents like Markdown or Emacs org-mode, and there are various editor extensions for it.
And now, in video form
Here’s a video of a recent stream in which I explored all of these tools:
I hope you find this rundown useful. What’s your favorite diagramming tool?


UMLet https://www.umlet.com/ . Not to be judged on beauty, but in contrast to other UML-editors at the time I did the evaluation (5 years?) adding attributes and style info doesnt end up in dozens of mouse-clicks. Instead, it provides a somewhat wiki-like syntax while (contrasting standard graphviz toolchain) still having the possibility to do “2D” and layout-stuff with the mouse. Connectors are also working (which was not the case for every tool back then).
graphviz and mscgen
usable in scripts, makefiles, doxygen and plenty of other tools
output in png, svg, eps
I use Python with the pydot library. Pydot is a Python wrapper around GraphViz.
Draw.io can create from csv data…. From cmd and also some custom modules. Really great program all around.